For mobile app marketers, improving conversion rates isn't just a performance metric — it’s the battleground for visibility and growth. With millions of apps crowding the market — over 1.93 million on the App Store and roughly 2.3 million on Google Play as of April 2025 — standing out is no longer a matter of launch-and-leave. Every impression counts, and every user who lands on your app’s product page is a potential win or a missed opportunity.
This is why conversion optimization has become one of the most focused areas in mobile growth and ASO strategies. Winning in today’s app economy means constantly iterating — testing visuals, updating messaging, refining positioning — to turn passive browsers into active users.
In the sections below, we’ll unpack what conversion rates really measure, which elements of your product page have the biggest impact, and how ongoing optimization can significantly improve your install performance over time.
At its core, an app store conversion rate tells you how effectively your app listing turns store visitors into engaged users. It tracks how many users take a specific action — typically installing the app — after viewing your store presence. This percentage gives you a clear snapshot of your funnel’s health: the higher the rate, the better your messaging is resonating.
You can calculate it with a simple formula:
Conversion Rate = (Number of conversions ÷ Total number of visitors) × 100%
Unlike raw download numbers, conversion rates offer a performance lens that’s relative and comparable over time. Whether you're optimizing a new app or reworking a long-standing listing, tracking this metric consistently is crucial for long-term growth.
Conversion rate tracking on the App Store and Google Play might seem similar, but there are key differences in how each platform measures user behavior.
On the App Store, impressions track visibility, but without filtering by “Source Type,” this metric may include product page views. This means data can mix users who simply saw your app in search results and those who actively explored your page.
In contrast, Google Play focuses on store listing visitors, which is similar to product page views on the App Store. However, Google Play doesn't track impressions, only counting users who land directly on the store listing.
These differences in tracking and user journey impact how you interpret conversion rates. Since Google Play starts counting when users visit the store listing, its conversion rates often appear higher than those on the App Store. This discrepancy affects how you optimize your app’s presence on each platform.
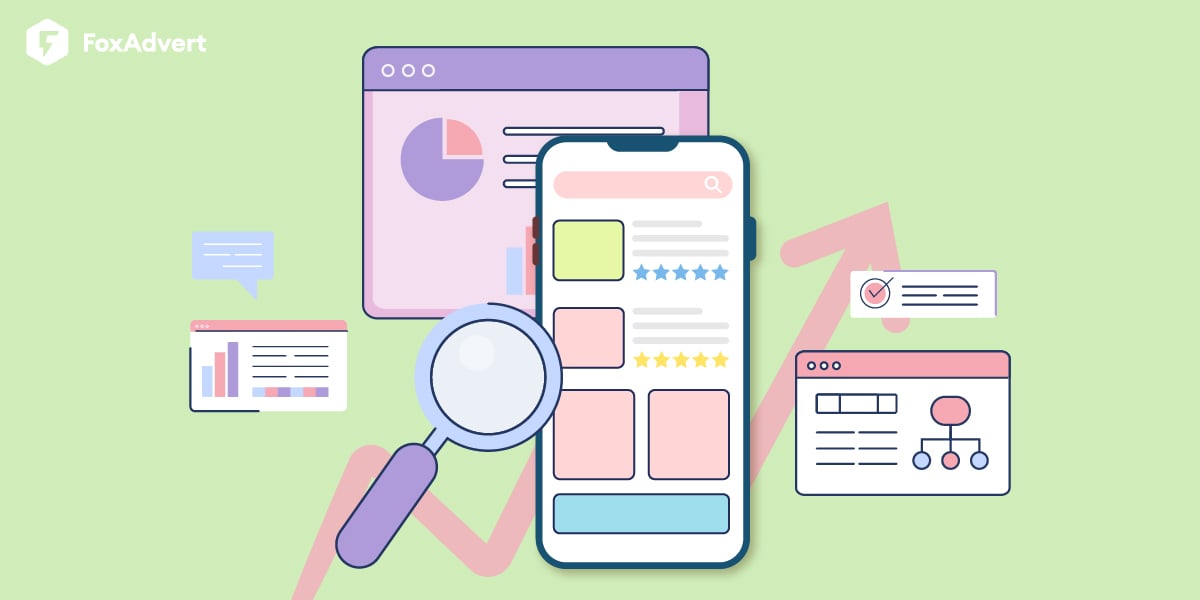
When it comes to optimizing app conversion rates, there’s no single silver bullet. Instead, a combination of factors shapes how likely users are to take that final step and hit “Download.” Let’s break down the key elements that tend to have the most impact.
First and foremost are your app creative assets—the icons, screenshots, preview videos, and promotional text that users see on your product page. These visuals aren’t just decoration; they’re your storefront, and they play a central role in capturing attention and communicating value. In a crowded marketplace, strong creative assets can be the difference between a user scrolling past or pausing to explore.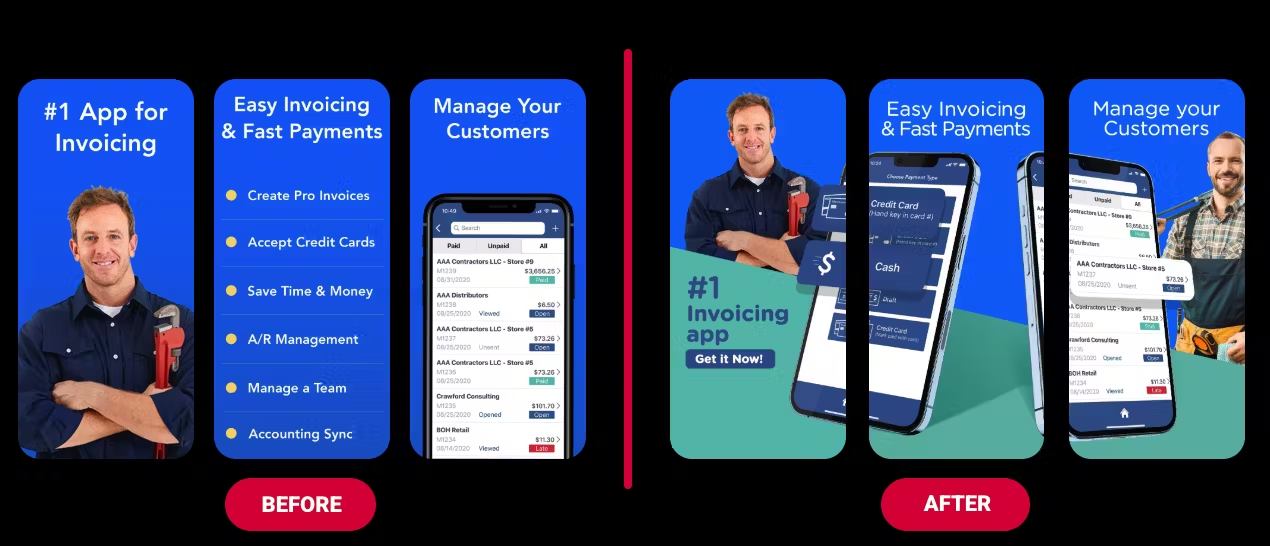
App category also plays a quiet yet powerful role. Where your app is positioned—whether in Health & Fitness, Games, or Productivity—determines the competitive landscape and the kind of visibility your app might gain. Higher category rankings naturally lead to more traffic from organic “Explore” or “Browse” sources, which can give conversion rates a healthy lift.
Another critical factor is your keyword rankings. When your app ranks well for the right search terms, it becomes easier for users to find you. And more visibility from relevant search queries often translates into more qualified traffic hitting your product page—and ultimately, more conversions.
Don’t overlook the influence of app size. Especially in markets with limited data plans or slower connections, users may hesitate to download an app that takes up too much space. A larger file size can quietly chip away at your conversion rate, particularly in the final step from product page view to download.
Then there’s the monetization model. Free apps naturally convert better than paid ones, simply because the barrier to entry is lower. When users are asked to pay upfront, even a modest price can be enough to create friction—so it’s no surprise that paid apps see lower conversion rates overall.
Of course, ratings and reviews remain one of the most influential trust signals. High ratings (especially 4 stars and above) combined with a steady stream of positive reviews help reassure users that the app delivers on its promises. On the flip side, poor ratings or negative feedback can quickly erode confidence and tank your conversions.
Lastly, we can’t forget about localization. A fully localized app page—one that reflects the language, cultural nuances, and even visual preferences of a specific region—can significantly increase your chances of winning over users in that market. People are far more likely to download an app when it feels familiar, relevant, and thoughtfully tailored to their expectations.
There’s no one-size-fits-all benchmark when it comes to app store conversion rates. What’s considered “good” largely depends on the platform, app category, target market, and a host of other variables we’ve already explored.
That said, we can look at averages to get a sense of the landscape. In 2024, the average conversion rate on the U.S. App Store—measured as first-time downloads divided by unique product page views—was around 25%. But this number only tells part of the story. Conversion performance varies wildly depending on the type of app. For example, apps in the Navigation category reached a staggering 115.5%—likely due to users downloading directly from search without even visiting the product page. Meanwhile, categories like Photos & Videos performed at a solid 60.8%, and Board Games sat at the bottom with a mere 1.2%.
Google Play paints a similar picture, but with slightly higher averages. In the U.S. market in 2024, the typical conversion rate landed at 27.3%. Again, category matters: Auto & Vehicles led the pack with an impressive 70.5%, while Board Games struggled here too, managing only 7.3%.
In short, don’t compare your app’s performance to a vague “industry standard.” Instead, benchmark against similar apps in your category and market—only then will the numbers start to make sense.
When refining your app store optimization (ASO) strategy, use the category-specific and overall benchmarks we’ve discussed as directional metrics—not absolute targets. A critical starting point is to define measurable KPIs that make sense for your app and your audience.
Before jumping into performance analysis, focus on executing the following core strategies to boost conversion rates on both Google Play and the Apple App Store.
Clarify your app’s value proposition and ensure it’s clearly reflected in your creative assets. Explore your users’ needs, pain points, and expectations through behavioral data and user reviews.
Also, observe your competitors—both direct and adjacent—to spot design patterns, messaging trends, and differentiation opportunities. The goal is to find a creative and strategic angle that helps your app stand out in a saturated marketplace.
Stay on top of evolving store guidelines, global market trends, and emerging user behaviors. All of these factors influence how your app is discovered and perceived.
Use this insight to build testable hypotheses—never rely on guesswork when making conversion-related changes.
According to internal analysis by FoxAdvert, creative assets—icons, screenshots, and videos—are some of the most impactful elements for increasing app conversion. That said, Apple App Store and Google Play differ in how users interact with these assets across the funnel, so your approach should be platform-specific:
|
App Creative Asset
|
Conversion Rate Uplift (App Store)
|
Conversion Rate Uplift (Google Play)
|
|
Icon |
22.8% |
20.2% |
|
Screenshots |
21.7% |
24.3% |
|
Video |
16.6% |
17.4% |
Google Play users tend to engage more with screenshots and videos, while icons make a stronger impression on the App Store.
App Icon
In the Apple App Store, the icon appears beside the “Get” button in browse tabs, giving it prime visibility. However, in search results, screenshots and videos tend to carry more weight.In Google Play, the icon plays a bigger role—it’s the only visual element visible in both the Search and Explore sections, and it’s more visually prominent than on iOS.
Icon Optimization Tips:
Reflect your brand personality through color and style.
Use symbols or visuals that instantly communicate your app’s purpose.
Borrow from category norms, but always find a way to visually stand out.
Screenshots
On iOS, the first three screenshots are visible in search results, making them essential to increasing Search conversions. On the product page, screenshots help drive both browse and search traffic to action—so prioritize clarity and impact in the first few visuals.
Screenshot Optimization Tips:
Keep them clean, legible, visually distinct, and branded.
Use short captions to reinforce your app’s value proposition.
On Google Play, prioritize informative over purely aesthetic designs.
Videos
Preview videos (iOS) and promo videos (Google Play) can deliver a narrative that builds interest—but only when used strategically. These assets appear within the screenshot gallery and don’t automatically autoplay, so the first few seconds are critical.
Video Optimization Tips:
Benchmark against your category: in some segments (e.g., Health & Fitness), video is expected; in others, it may offer little value.
Include captions, keep it concise, and frontload the most important content.
While visual assets drive first impressions, your text metadata also plays a role—especially on Google Play, where keyword indexing impacts visibility.
Subtitle (App Store)
A 30-character space under the app title, ideal for keyword placement and quick messaging.
Short Description (Google Play)
An 80-character teaser that appears above the fold. Use it to hook users and reinforce key search terms.
Long Description
On Google Play, keywords in the long description directly impact rankings. On iOS, this text doesn’t affect search visibility but can still influence downloads—especially if users scroll down. In either case, lead with value in the first three lines, as that’s what users see before clicking “more.”
Localization is more than translation—it’s about cultural alignment. When done right, it boosts both visibility and conversions by making your app feel native to each market.
Go beyond text. Localize visuals, references, models, holidays, and even design styles to match regional expectations.
Google Play simplifies this with auto-translation and supports up to 50 custom store listings tailored to specific regions or languages. Apple, while more limited in auto-localization, still benefits from a strong manual localization strategy.
The more relevant and relatable your content, the stronger the conversion impact.
Social proof directly influences downloads. Potential users scan reviews to compare apps—and negative sentiment can lead to lost installs.
Monitor feedback, respond actively, and extract product insights from user commentary. A well-reviewed app consistently outperforms competitors in the conversion race.
Conversion optimization is iterative. A/B testing removes guesswork and shows you what works.
Effective A/B Testing Tips:
Test one significant variable at a time (e.g., icon color, screenshot layout).
Avoid testing during volatile periods (e.g., seasonality or paid UA spikes).
Let tests run until they reach statistical significance—never stop early.
Finally, none of these strategies matter unless you’re measuring their impact. Track all relevant conversion metrics and use them to validate your hypotheses.
You can manually gather this data from Google Play Console and App Store Connect—or leverage analytics tools like FoxData, which consolidates key KPIs and surfaces insights to drive better decisions.
App conversion optimization is a continuous, data-driven process that requires planning, testing, and constant analysis. There’s no one-size-fits-all metric, but every adjustment and insight helps drive improvements over time.
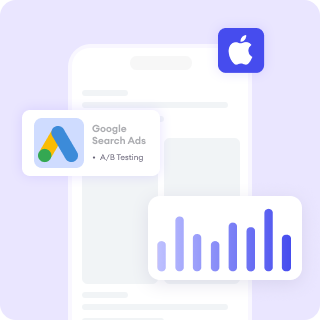
At FoxAdvert, we streamline this process with tailored app marketing strategies, from creative optimization to Apple Search Ads and paid social campaigns. With our data-driven approach, we help you turn impressions into downloads and users into loyal customers. Let FoxAdvert help you achieve your app’s full potential.
© 2021-2026 FoxAdvert. All Rights Reserved.